Ceterus Home
- Role
- Product Designer
- Collaborators
- Investor
- Director of Product
- Product Manager
- Director of Engineering
- Tools
- Figma
- Heap
- Claude Code
Ceterus provides automated bookkeeping and tax services for small businesses and franchises through an online portal with advanced reporting. The company primarily supported franchise owners with 2 to 10 locations, but churn increased as customers grew beyond 10. Our systems did not scale well, and larger clients struggled with slow or inaccurate bookkeeping and confusing workflows.
I led the design work from research and problem framing through final design. This work was completed alongside the design of a custom support ticketing system.
Note: This case study is based on a real shipped project. The interface shown throughout reflects a later redesign, not the exact UI that went into production.
Challenge
Larger customers were quickly becoming overwhelmed by the volume of action required across locations
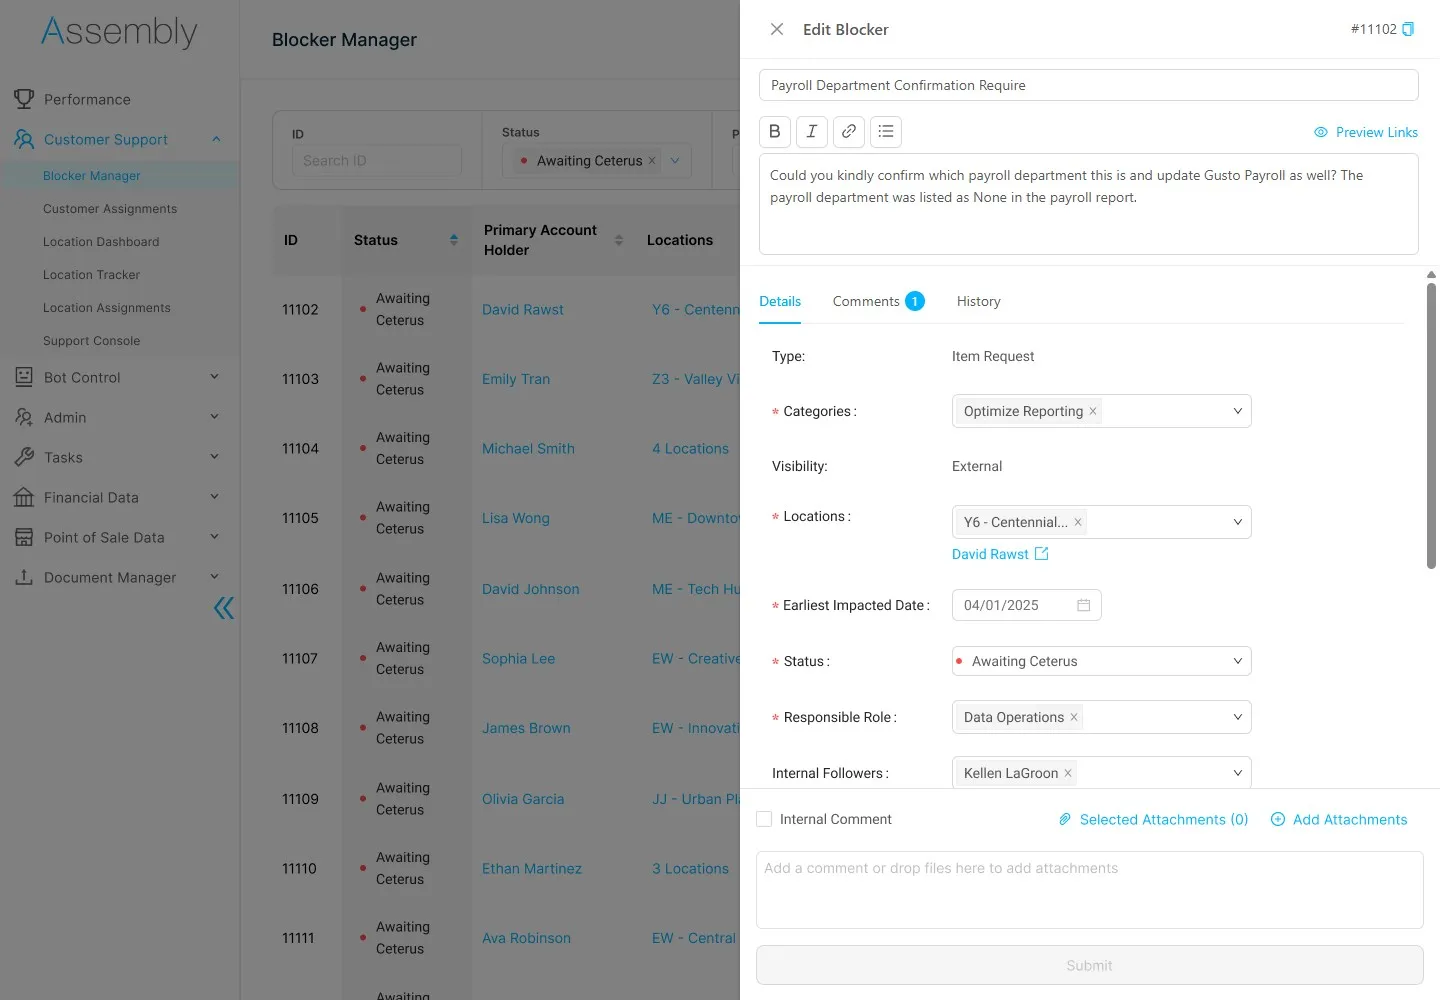
Communication inside the application was clunky and unintuitive leading to missed and undelivered messages
Features
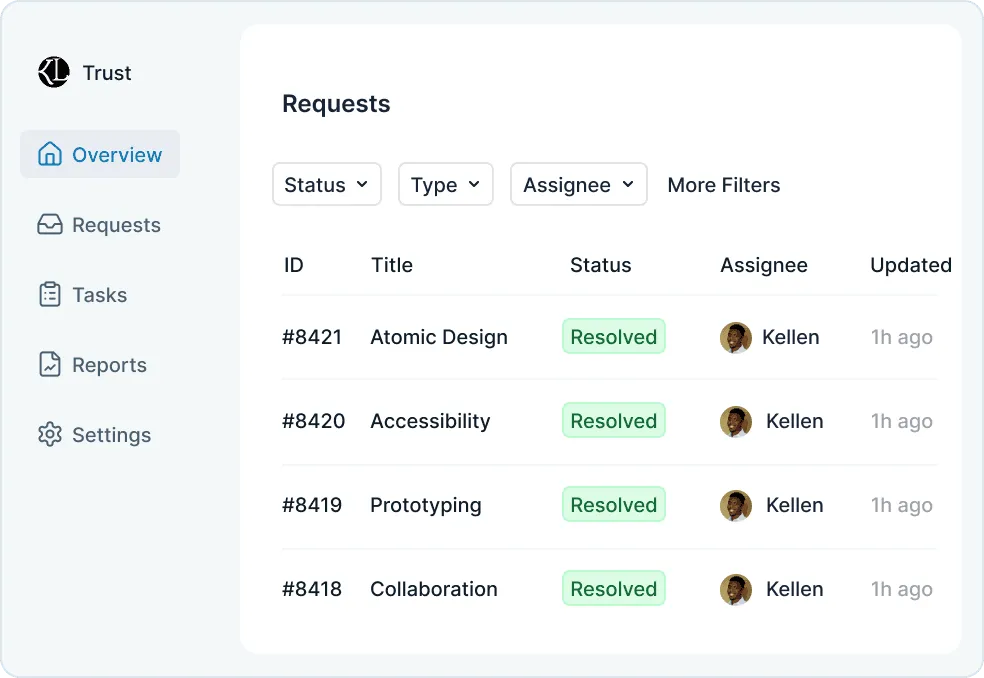
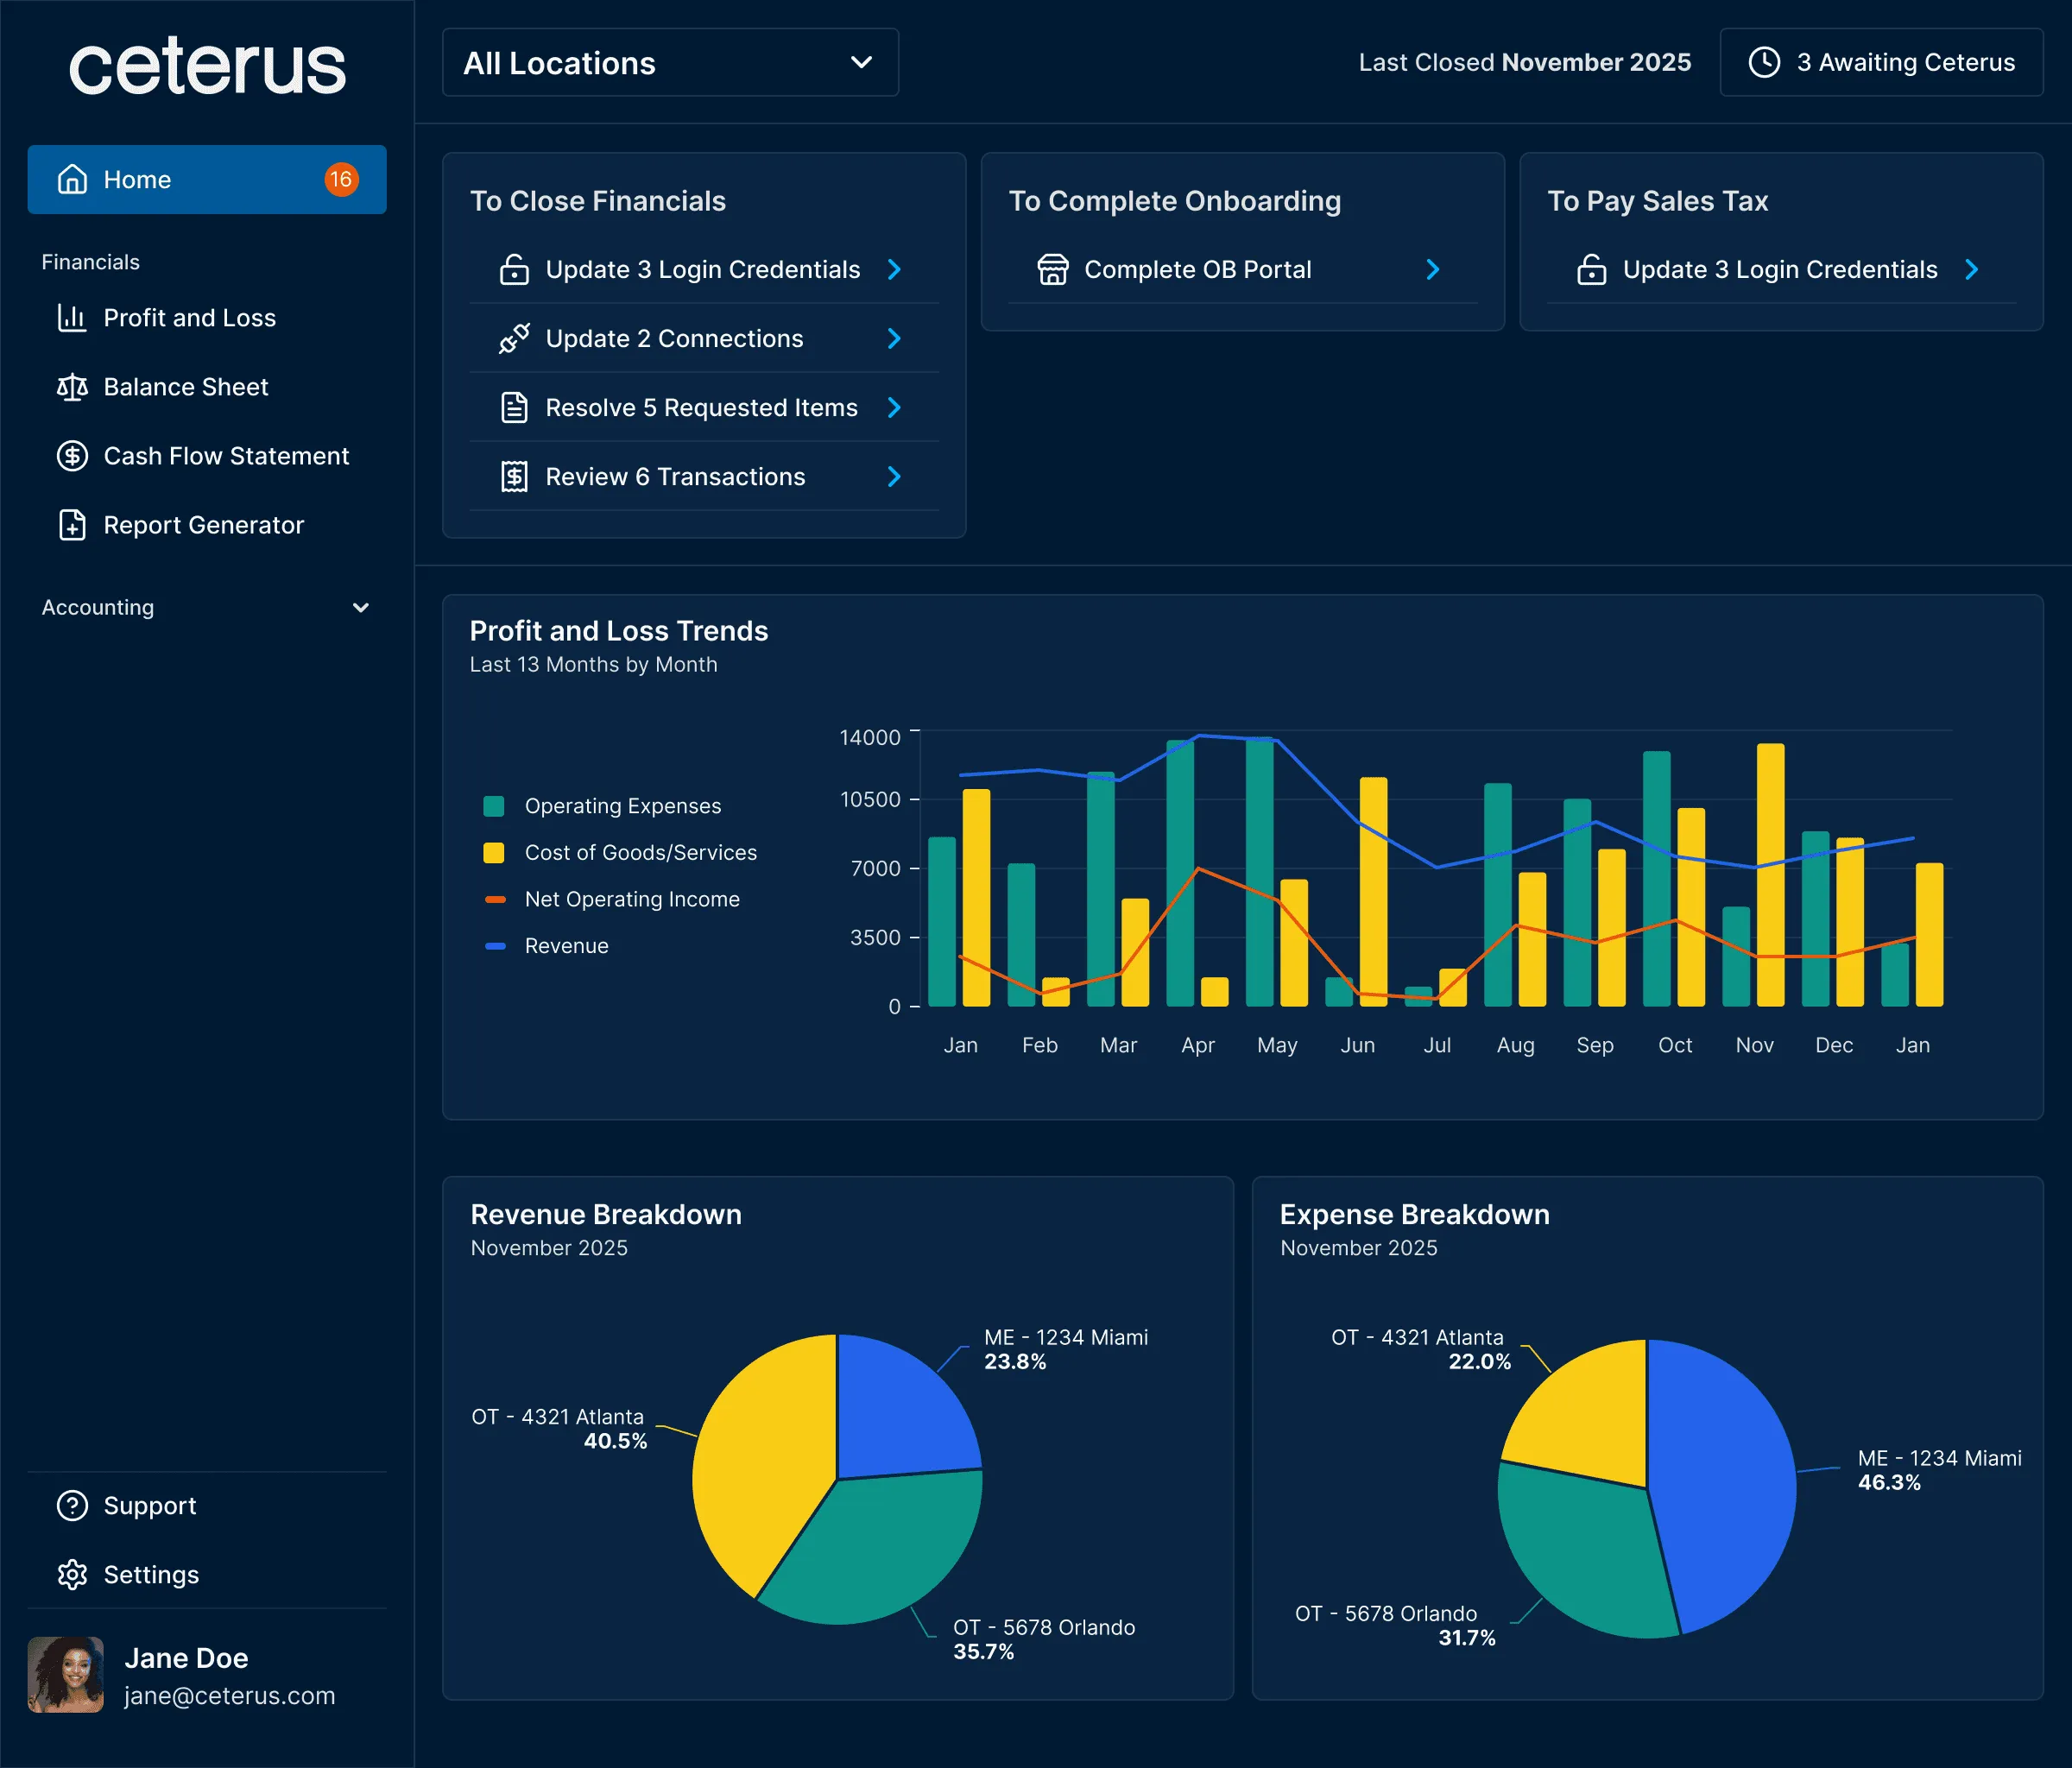
Bringing clarity to required customer actions
Business-critical tasks were not only split across multiple pages, but users lacked clear context around what was required to close their books. Customers often relied on external tools like spreadsheets to track and prioritize tasks for individual locations. Without a clear system inside the product, they risked submitting incomplete information, which could delay closing books across all locations. These challenges only worsened as the number of locations increased.
I proposed consolidating those pages into a single unified experience, since they represented two parts of the same workflow. I designed a new home page that brought both parts of the process into one place, allowing users to complete required actions without moving between screens. Tasks were grouped by what they accomplish, helping users prioritize based on business impact or speed of completion. A location filter further improved that prioritization by allowing customers to focus on specific locations instead of managing everything at once.
Streamlining business-critical customer input
Prior interviews had already surfaced major friction in the transaction categorization workflow, which lived on a page called Transactions to Code. Beyond missing context, the interface was bloated and difficult to navigate. Transactions were displayed as single-line table rows that required users to categorize, add details, and leave comments all in the same row, which extended beyond the screen width. The comment workflow was especially unintuitive, which often led to important clarifying details never being submitted.
While the home page addressed broader contextual gaps, the categorization experience still required significant improvement. I redesigned the workflow around a drawer that opened detailed transaction information without taking users away from the main page. This provided more space for a clear visual hierarchy and allowed the process to guide users step by step.
I also simplified the copy into plain language to make the process more accessible for users with less accounting experience. At the same time, I advocated for flexibility for power users through a feature called Accountant Mode. By default, the Chart of Accounts was grouped into guided categories to support less experienced users. When Accountant Mode was enabled, those groupings were removed, allowing experienced users to navigate directly to specific accounts.
Boosting engagement for higher location customers
When analyzing session data, I noticed that customers who regularly used analytics and reporting tools logged in more frequently and stayed more current on required action items. Many higher-location customers, however, were not using those features, which led to fewer logins and a buildup of unresolved tasks.
To increase engagement, I focused on two improvements. First, I introduced more flexible reporting filters. Previously, users could only view data for a single location or all locations combined. For customers managing many locations, viewing everything at once was often too broad to be useful. I added the ability to view subsets of locations, enabling more actionable analysis.
Second, I surfaced high-value data points through clearer data visualization. By identifying which metrics active users relied on most, I prioritized those insights and made them easier to digest. The goal was to increase the value of logging in, encourage more frequent engagement, and indirectly drive better completion of required bookkeeping tasks.
Conclusion
Problem
Lack of information about what processes were being blocked, left users unsure about what actions to prioritize
Solution
Clearly labeled and categorized action items help users handle tasks efficiently and provide us information early in the accounting cycle
Impact
20-30%
Reduction in close timelines
15-20%
Reduction in support ticket volume.
The impact was noticeable quickly. Users were highly engaged with features like transaction editing, and the clearer categorization of blockers contributed to a decreased time to closing books.
More importantly, the project created a clearer and more scalable foundation for supporting larger customers. It gave users more control, improved the visibility of critical workflows, and established a stronger product direction moving forward.